1.Introduction
One of the most discussed concepts in Landscape Archaeology (an “enormous topic” [1]) is the archaeological (inductive) inference, the process of defining the characteristic of the whole context, starting from the analysis of a part of it. Firstly, this is related to the practice of adopting a sampling strategy to analyse the object of the research (the population) and, secondly, to a limit of the archaeological investigation: the sites or artefacts detected on the surface never are the totality existed in the past because several biases affect this result.
The wave of interest in sampling theories and bias effects started in the 1960s [2] and reached its acme in the middle of the 1980s [3], when the post-processual critique started [4]. Particularly in the Americas, trying to avoid the risk of omitting key sites - the so-called “Teotihuacan effect” [5] -, the archaeologists started to adopt a “full-coverage” approach, investigating the entire context, anyhow with a low level of intensity [6]. On the other hand, in the Mediterranean countries, the pedestrian surveys still prefer a high level of intensity and investigate small area of 10-25 sq. km [7]. This was a consequence of the debate on the biases affecting the survey results, a discussion particularly strong in Mediterranean archaeology; in the last two decades of the 20th century, to augment the intensity of surveys seemed the easier solution [8]. Furthermore, the difference between American and Mediterranean archaeology is linked also to a different approach to the landscape. In American archaeology the site remains the fundamental unit of analysis, while European and Mediterranean archaeologists “have moved more clearly toward the landscape approach, with individual features or even artefacts as the basic element of analysis” [9].
The impact of the biases affecting the results of a survey reaches an acme when archaeologists investigate an alluvial floodplain [10]; here, only an integrated approach between different methodologies (geomorphology, topography, artefacts survey, archaeobotany ..) can help to shed a light on past landscapes history and to limit the impact of different kinds of biases [11].
This paper aims to outline the main limits that a landscape archaeological project has to face examining a floodplain with a high rate of vertical growth of ground levels, due mainly to the combined action of subsidence and alluvial sedimentation phenomena. Indeed, the case-study area is a portion of the Po Valley lowland, the Ravenna hinterland, equal to approximately 525 square km and located near the northern coasts of the Adriatic Sea (Fig. 1). This region is currently called “Bassa Romagna›› and since 2009 it has been the research area of the “Bassa Romandiola›› project, which included artefact surveys, geophysics analysis, archaeobotanical and geoarchaeological researches, and written sources analysis. The limits faced here are characteristic of a wide floodplain area and the solutions applied would be helpful for other archaeological research projects.
The first section of the paper is devoted to present the geographical and geomorphological characteristics of the case-study area, the project history, and the research methods; the second section is focused on the characteristics of the archaeological data collected, discussing in particular their limits and the influence of the main biases detected; the third and final section presents some of the solutions applied in order to overcome these limits.
2. The case-study area and the research project
2.1. Geography and Geomorphology of Bassa Romagna region
The Romagna region corresponds to the south-eastern part of the Po Valley; it is today more a cultural and historical region, composed of the provinces of Ravenna, Forlì, and part of that of Bologna. The natural borders of this region are the ancient river Po of Primaro (Reno nowadays), north of Ravenna, the Sillaro river, westward, the Apennine ridge (approximately) and the river Tavollia southward, and, finally, the Adriatic coastline to the east (Fig. 1) [12]. The lowest part of this area is currently characterised by the presence of intensively cultivated lands, extending between several urban centers and towns densely populated (Fig. 2). This lowland was the result of the action of the aggradation of Apennine rivers, interacting with the southern branches of the Po river. From the end of the 13th century this area was identified with the name “Romandiola” and the region started to have a clearer territorial identity [13]. “Bassa Romagna” (namely Low Romagna) is currently the northern and lower part of Romagna, located westward of Ravenna; it corresponds to a historical region called “Territorium Faventino acto Corneliense” during the Middle Ages and, from the 15th-16th centuries, “Romandiola Estensis”, because it was the portion of “Romandiola” that went under the control of the lords of Ferrara, the Estes.
From the geological point of view, the soil surface in Bassa Romagna is exclusively molded on alluvial and swamp sediments mainly represented by the layers of the Subsintema of Ravenna (AES 8) - dated back to last 15.000 years - and in particular the upper part of it, the Unità of Modena (AES 8a), which includes the sediments born from the 4th century CE onwards [14]. The intense activity of alluvial sedimentation of the Apennine rivers is here accentuated by a high rate of subsidence, which reach one of the highest values of the southern part of the Po Basin [15]. The main consequence is that the ancient ground-levels are sometimes buried several metres deep; for instance, sometimes in the investigated region the Late Republican/Imperial stratigraphies are buried 10 metres deep [16]. Moreover, this aspect is characterised by a high rate of variability: this depends on the morphological characteristics of the ancient landscape, which alternated highlands (e.g. inactive fluvial ridges) and depressed area (e.g. wetlands) [17]. These elements also depict a very unstable territory from the geomorphological point of view, already before the Roman Age contrasted by the anthropic actions, which were finalised to manage the landscape to assure water drainage and supply [18]. This makes the archaeologists’ job in this kind of contest more complex. They are obliged since the preliminary phase of the research to have a systematic and wide-range approach, to take into account several possible parallel interpretations, and to consider in a single analysis framework different kinds of data — the only approach that can limit the imponderable.
2.2. Project history and research methods
The landscape archaeology project “Bassa Romadiola” was started in 2009 and, until now, it investigated through intensive artefact surveys approximately the 15% of the territory of Bassa Romagna (i.e. 78 sq. km of the whole context, namely 525 sq. km). Since the beginning of the research several field campaigns took place (Fig. 3) [19]: in 2009, in the area of Lugo [20]; in 2011, in the area of Conselice [21]; in 2012, in the area of Bagnacavallo and Fusignano [22]; in 2016, in the area of Bagnacavallo and Lugo [23]; in 2018, in the area of Cotignola.
The objective of the project was to define the history of the settlement patterns in this portion of the Ravenna hinterland, from a diachronic perspective; in particular, we focused into trying to solve a gap in the historiographic research, which was not able to clearly define the settlements patterns’ transition from the Roman Age to the Middle Ages.
The on-field research method was that of the systematic and intensive survey [24]. In the sample area, every cadastral parcel with a minimal level of visibility (i.e. a “Topographical Unit”) was systematically surveyed by the archaeologists, walking in parallel lines with a distance of 10 metres from each other (the “Intensity” of the survey) [25]. Thus, the “Topographical Unit” was considered the box in which any archaeological find was located, as well as, anyway, the trace on the ground of human and natural activities [26]. During the artefact survey the position of every single find has been recorded with a GPS receiver, like in a siteless survey [27]. Anyhow, any area with a higher density of artefacts, above the background scatter of the Topographical Unit, has been interpreted as an archaeological “Site” [28]. In this case, the intensity of the survey increased and the distance between every archaeologist was set to 1 metre from each other; every archaeological find has been collected, except the architectural ones (i.e. bricks or roof tiles). This double approach (site/siteless) allowed to map the continuum of the artefact distribution [29], preserving anyhow the interpretative category of “Site”, useful for further archaeological analysis, the public bodies policies and the related instruments of protection.
3.Why “Looking through the keyhole”? Limits and characteristics of the collected data set
3.1.First of all: sampling the context
The research started already before fieldwork, with a review of the previously known data, analysing written sources archives, previous archaeological discoveries, and the geomorphological evolution of the context [30]. We were not working in a vacuum, but no archaeological field systematic research was done before in this area. The aim of this phase was to acquire the existing knowledge on the investigated context and to define the sampling strategy of the artefact survey. The data set produced was a geo-database in which each record was associated with a geometric geo-referenced feature (points, lines, and polygons); it included 625 entries, divided into the following categories (Fig. 4 and Tab. 1):
- Sites and landscape features mentioned in edited written sources, focusing on post-roman Ages (5th-15th centuries CE);
- Archaeological sites, mentioned in edited studies;
- Geomorphological features.
| Categories | Typologies | Geometrical features |
|---|---|---|
| Sites and landscape features mentioned in edited written sources | Fortified settlements (towers and castles); Isolated houses; Churches (ecclesiae, plebes); Harbors; Hospitals; Productive sites; Land exploitations structures (curtes and massae); Mills; Monasteries and convents; Open villages; Marshes; Channels; Forests | Points, lines, and polygons |
| Archaeological sites | Burial areas; Isolated houses; Castles; Churches; Land exploitations sites; Productive sites; Monasteries and convents; Harbors; Nucleated settlements; Channels, bridges, and fords; Road structures; Isolated finds | Points |
| Geomorphological features | Fluvial ridges and Fluvial branches, according to edited studies and their hypothesis | Polygons and lines |
Table 1. The preliminary phase of the Bassa Romandiola project had the objective of summarising the existing knowledge on the investigated area and produced a spatial database; here the entries’ categories:
In this kind of landscape, the main challenge is to investigate the history of fluvial systems; scholars tried to clarify their recent evolution, but the unresolved questions are still numerous [31].
By crossing archaeological, historical, and geomorphological data, this first phase allowed to divide the research area into Landscape Strata, belonging to three main categories (Fig. 4):
- High Floodplain;
- Fluvial Ridges in Low Floodplain;
- Low Floodplain.
To adopt a sampling strategy was the only possibility in order to balance resources (time and costs), with the objectives of the research. Furthermore, the extreme variety of the examined area forced to change the sampling strategy in each stratum, as summarised in the following table (Tab. 2):
| Landscape Stratum | Geomorphological, archaeological, and historical main characteristics | Sample characteristics |
|---|---|---|
| i. High floodplain | Stable floodplain; Roman Age sites in surface or buried maximum 3-4 metres deep; centuriation mainly conserved | Rectangular transect oriented according to the centuriation (approx. N/W-S/E) and a within-stratum sampling fraction of 50/100 |
| ii. Fluvial ridges in the low floodplain | Stable floodplain; Roman and Bronze Age buried under plough soil; Roman centuriation retraced in the Late Middle Ages or not conserved and replaced by medieval or modern land divisions | Rectangular transects oriented N-S or E-W, with a width of 1-kilometre multiples, which cover the whole fluvial ridges, and a within-stratum sampling fraction of 100/100 |
| iii. Low floodplain | Unstable floodplain, generally marshes dried in Modern and Contemporary Age; Roman and Bronze Age buried from 5 to 10 metres deep or more; centuriation mainly absent | Area excluded from the sample |
Table 2. Landscape Units categories in Bassa Romandiola projects and sampling strategy:
Thus, by choosing different sampling fractions in each stratum - but with a systematic approach -, we applied what we can define a systematic disproportional stratified strategy [32]. Anyhow, we chose high fraction values, from 50% to the full-coverage, because the previous archaeological knowledge was very superficial; moreover, since the designing phase, we left the possibility of doing some minor enlargements of the sample during the fieldwork, with an adaptive strategy [33].
The sampled area covered 150 sq. km, equivalent to 22% of the Bassa Romagna sub-region, and it avoided the “Low floodplain” stratum (Fig. 4) [34]. The transects in the High floodplain stratum are 8, designed according to the main cadastral limits of the landscape and a sampling fraction is 50/100. On other hand, the transect in the “Fluvial ridges in low floodplain” stratum are 15; they are oriented according to the kilometric grid, north-south or east-west, and designed to assure almost a full-coverage of this stratum.
3.2. The “keyhole”: the data set collected
In the ten years of research 71 artefacts concentrations have been detected. After an interpretative phase, they have been classified into different categories, according to their dating and characteristics, as summarised in the following table (tab. 3).
| Sites categories | Total Number | General Chronology |
|---|---|---|
| Castle | 4 | 11th/13th-15th |
| Church | 4 | 11th-15th |
| Early medieval-High Medieval house | 22 | 8th-12th c. |
| Late Antique-High Medieval house | 4 | 5th-12th c. |
| Late Antique house | 1 | 5th-7th |
| Late Medieval-Modern Age farmhouse | 8 | 14th-18th |
| Late Medieval-Modern Age productive site | 6 | 14th-18th |
| Medieval Harbor | 1 | 11th-15th |
| Medieval not-fortified village | 2 | 11th/12th-14th/15th |
Table 3. Archaeological sites detected (2009-2018) [35]:
It is not my aim to discuss in this paper the settlement patterns evolution in this area or the historical phenomena connected to that, e.g. the land reclamation processes [36]; as anticipated, I would like to focus on the methodological aspect of surveying such a kind of landscape. Just for the sake of clarity, the project allowed us to find an answer to our first question: what happens in this part of Romagna after the end of the Roman Age and how the settlement patterns evolved. Summarising, the artefact survey identified a relevant growth in the number of the sites between the 9th-10th centuries, the Carolingian and Ottonian Age, sometimes in continuity with Late Antique sites. This process took place according to two main trends: a dispersed pattern (as recorded in the area of Zagonara, Fig. 5a), as well as a clustered pattern (as recorded in the area of Bagnacavallo, Fig. 5b). The clusterization of the habitat appears to have been a frequent trend in Romagna lowland during the Early Middle Ages, as already documented in other contexts of the Ravenna hinterland itself or in the area of Cesena (40 km south of Ravenna) [37].
The main bias that clearly affected survey results for such a context of a plain with a high rate of vertical growth was a macroscopic factor, acting at site-level [38]: the geomorphological processes. The results of the artefact survey are drastically limited in comparison to the surveyed area. The most ancient sites have been recorded in what we can define as geomorphological windows of less than 10 square km. They are areas in which portions of natural paleo-soils are exposed on the surface, or limitedly buried by alluvial phenomena (so still reachable by plowing). Generally they correspond to paleo-fluvial ridges, higher than the rest of the lowland around. After their deactivation, they were chosen to place settlements and start land-exploitation [39]: they were safe from floods, easily drainable, a suitable environment for agriculture, and natural and secure paths that crossed lowland and marshes and linked localities. Post-depositional alluvial phenomena can bury these landforms, making them impossible to detect simply through a micro-morphological approach [40].
Thus, it is clear that interpreting these data is similar to trying to understand what is happening inside a room looking through the keyhole.
The area around, indeed, was not an empty landscape: sites presence is attested in the medieval written sources; buried sites are detectable in the literature and located under the plough soil level. All that:
- Greatly reduces the possibility of applying reliable inference processes, at least based on a simply frequentist approach;
- Moreover, shows the difficulty of performing a completely correct stratification analysis of this kind of context, cause of its extreme geomorphological variability, not totally clear before field survey;
- Finally - and obviously - limits knowledge from the chronological point of view.
It does not mean that sampling is not useful or effective in this kind of context, on the contrary: despite the limits, it can address the research and make it more efficient. Moreover, it can clarify the sustainability of the research questions, which since the beginning move the archaeologists: if your research topic is to define how the transition from the Protohistoric to the Roman landscape occurred, to survey the northern part of Bassa Romagna is not a good option.
If the impact of geomorphological biases is well-known by landscape archaeologists since the 1960s and 1970s [41], anyhow, the existing maps hardly have enough resolution to represent the actual geomorphology of an area with such a local level of variability, as the Bassa Romagna [42]. Not every single window can be predicted and dated a priori.
Furthermore, the systematic survey itself can complete the geomorphological knowledge of the context in a diachronic manner. During this field campaign, we collected all the artefacts, in-site and off-site [43]. The earliest dating of a site, or, if absent, of the artefacts off-site, provides a reliable terminus ante quem to date the geomorphological stability of a Topographic Unit. With a process of spatial interpolation, it is possible to extend the measure to the not sampled portion of the context (Fig. 6) [44]. Obviously, “one swallow does not make a summer”: a single artefact is not enough for that; a consistent set of artefacts is better, and even more an archaeological site or a set of these [45].
Sometimes the data set collected confirms the previous knowledge; sometimes it can also integrate it. Geologists often base their considerations also on morphometry; the fluvial ridges are mapped frequently detecting anomalies in ground elevation. Thanks to that, scholars mapped the fluvial ridges so-called “of San Pietro in Sylvis” (5th-11th centuries) and “of Bagnacavallo”(11th-13th centuries), in the northern part of Bassa Romagna [46]; these hypotheses were confirmed by the survey and this is clearly visible in the sites distribution map (Fig. 5b). Anyhow, the systematic approach of the survey allowed us to detect other geomorphological windows, assessing and improving geologists’ reconstructions. This is the case of Zagonara area: the existence on the surface of Late Antique and Early Medieval sites suggested the presence of an emerging paleo-soil, probably the top-soil of a fluvial ridge; it was not recognizable through the morphometric analysis of the surface because it has been buried and hidden by following alluvial events and currently its surface is - paradoxically - at a lower level than the area around (Fig. 7); the geoarchaeological analysis of the sub-surface confirmed this hypothesis [47]. This paleo-soil can be probably related to the depositional activity of the near so-called paleo-ridge of Barbiano, partially buried here [48].
The second element that affected sites’ visibility after geomorphological factors was the land use/land cover; the proportion between ploughed lands (high level of visibility) and orchards, vineyard or, worst, grassland (low or null visibility), changes radically, according to the geographical context, agrarian traditions and policies, and geopedological characteristics. The stratum of low floodplain has a prominence of extensive ploughed soils, mostly composed of distal alluvial deposits of clay; anyhow, the geomorphological biases do not allow to take any advantage from that (Fig. 8a). The stratum of the middle floodplain is characterized by a proportionate balance between different cultures (Fig. 8b); anyhow, going southwards, towards the high and stable floodplain, the portion of orchards and vineyards becomes bigger and bigger, according to the more and more intense agricultural practices (Fig. 8c). More the burden of the geopedological biases decreases, more the relevance of land use/land cover biases, unfortunately, increases.
Changing the point of view and taking into account the artefact level (the microscopic one [49]), the main bias is related to the action of mechanical agricultural instruments on artefacts’s distribution and dimensions. The Romagna countryside has been intensively cultivated since the beginning of the 20th century and men covered the area with orchards and cereals fields. Since that time the archaeological deposits on the surface have been destroyed and dispersed; artefacts themselves have been fragmented in smaller and smaller sherds. This aspect is clearly recognizable in the field. The fragmentation index of sherds is relevant in any site detected, with a substantial consequence in quantification [50]. Some areas, with a density of artefacts higher than the normal but lower than the sites themselves, do not seem simply a sort of background noise, but sites with a very low level of visibility, because strongly dispersed by mechanical instruments, or partially affected by the “traffic light” effect: a site is not clearly visible every year, but randomly, as a consequence of the ploughing cycle [51].
It is clear that all the mentioned aspects surely deserve future definitions and quantification analysis. The job of surveyors seems pretty hard in a plain with a high rate of vertical growth such as that of Bassa Romagna.
However, is our data set reliable?
Archaeologists have to deal with the paucity of data and frequently they argue inferring from absence, despite the adage “Absence is not evidence of absence” [52]. For instance, that happens when we suggest that a site have been abandoned in a certain period, because we do not find any diagnostic artefacts of that period [53]. Similarly, what has been recorded on the surface is not representative of the sub-soil and, furthermore, it can be also a false-positive: not all the concentrations are actually a site [54]. Anyhow, the frequency of the negative results can have such a degree of likelihood, to “create situations in which inferences from the absence of evidence have a respectable plausibility” [55]. In our case-study all the sites in panes A and B of Fig. 5, do not have any diagnostic artefact more recent than the 12th/13th century; consequence: it is highly plausible they have been abandoned during the 13th century.
At the same time the statistical frequency of the recurrence of a result - so a positive result and not a negative one - suggests a historical trend: in the area of Zagonara between the 9th/10th the 100% of sites are dispersed, while, in the same age, in the area of Bagnacavallo they are clustered.
This is a trend and the answer to my question has to be yes.
4. Filling the gaps
As expected, in this floodplain with a high rate of vertical growth the main bias is obviously the geomorphological one. What was unexpected was the elevated geomorphological variability of this area that makes any inference process harder. The second bias, in order of relevance, was low visibility caused by intensive agriculture, which even more limited the comprehension of the settlement patterns.
These biases - micro and macro - have been compensated in different ways:
- First of all, with a quantitative and spatial approach. Despite the critique born in the ’90 towards any data treatment of this kind, strongly influenced by the postmodern theoretical framework [56], different scholars tried to find a path between this position and the heuristic impasse of post-processualism [57]. Visibility bias can be managed with the application of interpolation analysis, which can take into account the quantity and dislocation of sites or artefacts and survey biases (visibility, geomorphology, intensity), mainly recurring to trend-surface analysis [58]. Anyhow, in our context, the plausibility of any inference is connected to the resolution of the knowledge of the surface geomorphological variability, that afflicted not only the number of artefacts and sites detectable, but it was also a factor that strongly influenced the anthropic settlement choice. A geoarchaeological systematic field campaign started in 2017/18, including mechanical corings, manual augerings and the review of the past knowledge [59]. The main aim is to define Digital Elevation Model of the floodplain in the different historical phases (Fig. 9) [60]. It is obviously a constant work in progress, which gradually improves with the advancements of the analysis carried out by all the actors involved in the study of the geomorphology of the area (public bodies, private subjects, research institutes etc.). Anyhow, it has to be done and keep updated to reinforce any further interpretations of historical landscape evolution.
- The study of the historical Ages allows us to cross the archaeological data set with another resource: written sources. Written sources analysis helps to enforce historical interpretation and to fill empty-scapes. This can be effective at the site-level - to clarify the settlements’ dispersion, their network, and their political, social, and material characteristics - ; furthermore it can be effective also for hypothesizing the environmental scenario in which site and anthropic actors were placed (Fig. 10) [61].
- Environmental factors are clearly fundamental in any settlement reconstructions; an archaeobotanical analysis of the area (pollen and macro-rests), with a landscape/territorial approach [62], that means addressed not only to infra-site analysis, but also to off-site one, is particularly relevant to understand these socio-ecological systems, exposed to extreme events (but not necessarily weak and fragile).
- Finally aerial and satellite remote sensing, if systematically performed, can integrate the dataset, allowing to collect both archaeological and geomorphological evidence, to check further with on-field analysis [63].
Two final considerations to conclude this section: only crossing all this information - archaeological data set, paleo-geomorphology, written sources, environmental factors - we will be able to inference with a probabilistic approach and, thus, apply bayesian statistics [64]. Second, a multiscaled approach seems the right way to investigate this relevant amount of aspects, at different levels of resolution and with a multidisciplinary approach.
5. Conclusion: infinite parallel worlds?
To produce a synthesis on settlement evolution in this kind of landscape, we are forced to reason in a binary way: 0 or 1, presence or absence. Between the two we have to privilege the presences, avoiding the appeal to inference from absence. Any gradient or nuance brings us into a sloping ground. This happens when we try to develop probabilistic previsions or, simply, interpretations of what happens outside our sample or our geomorphological window. What we saw from the keyhole was not enough, but it was something to start with.
It is something like it happens in the quantum physic: a phenomenon can be in different status at the same time, until we have the possibility of observing it; this brings to an infinite number of overlapping possibilities and, potentially, infinite parallel worlds [65]. Luckily in archaeology, we have (at least until now) something of material to touch or see; the number of parallel worlds can be limited with a long process of integration of a set of data, trying to find the right dialogue between different sources and approaches.
Indeed, also this kind of landscape, a plain with a high-rate of vertical growth, has brought surprises and unexpected results (such as the Late Antique sites on the surface in some northern areas). In that, there is a strength and an opportunity: this kind of context allows to investigate the birth of settlements free of any past legacy. There was no Roman villa survived in elevation in the area of Bagnacavallo when a landowner decided to built his farm or his house between the 5th/6th c.; similarly it happened here in the 9th/10th century, when peasants decided or have been forced to build their houses in a clustered manner. In other terms, within the landscape, there were no previous attractor places, which could assure the continuity [66]. After the extreme events that buried the past settlements, in the 5th as well as in the 9th/10th century, the floodplain was an empty canvas in which people could choose to settle as they preferred.
Furthermore, this kind of landscapes is frequently composed of marginal lands: fragile ecosystems exposed first to extreme events and, because of that, obliged to be more resilient to survive [67]; the study of these historical landscapes can help contemporary societies to face future challenges.
Thus, as in any other landscape archaeological project, also in a such difficult context, a systematic and multiscaled approach is always the best one [68].
To conclude, facing a context like this one, we can suggest to:
- Make more intense the dialogue with other methodologies, with a multiscaled approach;
- Identify the biases and, as far as possible, quantify them;
- Base statistical inference (better Bayesian) on your best data set, with the consciousness it can be improved in time.
Acknowledgments
The Bassa Romandiola project is funded by several private and public bodies, in particular: the Centro di Studio sulla Romandiola nord-occidentale; the Comitato per i Beni Culturali del Comune di Lugo; the cities of Conselice, Cotignola, Fusignano, and Lugo; the Flaminia Foundation; the Cassa di Risparmio e Banca del Monte di Lugo Foundation. I would like to thank Michele Abballe, Alice Ferrari, and Celeste Fiorotto for the help in producing some of the figures of this article; Michele Abballe, Andrea Augenti, Federica Boschi, and Stefano Marabini for reading the text and for the precious suggestions. Several topics included in this paper are the result of the discussions I had with dr. Nicola Mancassola, who I have to thank for mentoring.
 Fig.1. Northern Italy and the Po Valley, the Romagna region, and the area investigated (the Bassa Romagna).
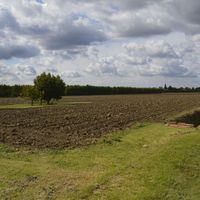 Fig. 2. The peculiar aspect of the Bassa Romagna landscape: ploughed lands between orchards and vineyards (picture by the author).
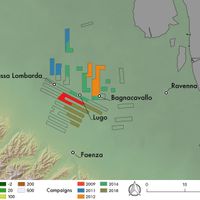 Fig. 3. Sample area of the “Bassa Romandiola” project, with the different field campaigns carried out. Base map: shaded Tinitaly DEM (Istituto Nazionale di Geofisica e Vulcanologia).
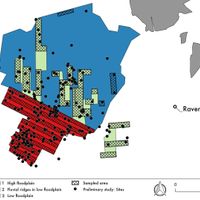 Fig. 4. Preliminary database (only the sites' entries, according to archaeoloagical and written sources), Landscape Strata, and the sampled area of the “Bassa Romandiola” project.
 Fig. 5. Detected sites in the 5 field-campaigns (2009-2018) performed since now. In the bigger panes, the geomorphological windows in the area of Zagonara (pane A) and Bagnacavallo (pane B).
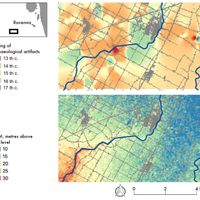 Fig. 6. Interpolated raster of the surface soil geomorphological stability through off-site and site artefacts, in the area of Cotignola (RA). Authors: Alice Ferrari and dr. Marco Cavalazzi.
 Fig. 7. Section east-west of the sub-soil in the area of Zagonara (by Abballe, Cavalazzi in press).
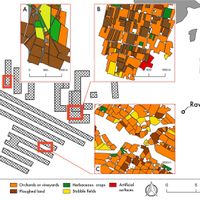 Fig. 8. Three different sampled transects: Land use / land cover proportion in each one.
 Fig. 9. Paleo-DEM of the Roman layers in the area of Zagonara (Lugo, RA). Author: Michele Abballe.
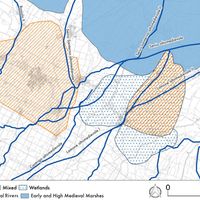 Fig. 10. Environmental medieval matrices in Bassa Romagna region, based on the written sources analysis (9th-11th centuries, cfr. Fiorotto 2018). Basemap: Carta tecnica regionale, Regione Emilia - Romagna. Author: Celeste Fiorotto.


Bibliography
- Abballe, Michele. 2017. ‘The Medieval Rural Settlement in Bassa Romagna: A First Predictive Model and Future Directions’. Groma. Documenting Archaeology 2, DOI: https://dx.doi.org/10.12977/groma7.
- Abballe, Michele. 2020. ‘From Scattered Data to Palaeolandscape Reconstruction: a Case Study from the Romagna Plain, Italy’. In Humanities in the third millennium: Approaches, Contamination, and Perspectives, edited by Marta Tagliani, Vittoria Canciani, and Francesco Tommasi, 73–85. Verona: Cierre Edizioni.
- Abballe, Michele, and Marco Cavalazzi. In press. ‘Flood Risk and Socio-ecological Resilience in a Late Antique and Medieval Countryside: Managing a Post-Roman Alluvial Landscape in the Ravenna Hinterland’. In ICYRMA – II° International Congress for Young Researchers in Middle Ages, Proceedings of the Conference Held in Evora (PT), 13-15 November 2019.
- Alcock, Susan, and John Cherry. 2016. Side-by-side Survey: Comparative Regional Studies in the Mediterranean World. Oxford: Oxbow Books.
- Ammerman, Albert J., and Sandro Bonardi. 1981. ‘Recent developments in the Study of Neolithic Settlements in Calabria’. In Archaeology and Italian Society, edited by Graeme W. W. Barker and Richard Hodges, 335–42. Oxford: British Archaeological Reports.
- Banning, Edward B. 2002. Archaeological Survey. New York: Springer Science & Business Media.
- ———. 2020a. ‘Sampled to Death? The Rise and Fall of Probability Sampling in Archaeology’. American Antiquity: 1–18.
- ———. 2020b. ‘Spatial Sampling’. In Archaeological Spatial Analysis. A Methodological Guide, edited by Mark Gillings, Hacıgüzeller Piraye, and Lock Gary, 40–51. London; New York: Routledge.
- Banning, Edward B., Alicia L. Hawkins, Sarah T. Stewart, Philip Hitchings, and Steven Edwards. 2017. ‘Quality Assurance in Archaeological Survey’. Journal of Archaeological Method and Theory 24 (2): 466–88.
- Binford, Lewis R. 1964. ‘A Consideration of Archaeological Research Design’. American Antiquity 29 (4): 425–41.
- Bintliff, John, and Anthony Snodgrass. 1988. ‘Off-site Distributions: a Regional and Interregional Perspective’. Current Anthropology 29: 506–13.
- Bitelli, Gabriele, Flavio Bonsignore, and Marco Unguendoli. 2000. ‘Levelling and GPS Networks to Monitor Ground Subsidence in the Southern Po Valley’. Journal of Geodynamics 30 (3): 355–69.
- Bondesan, Aldino, and Mirco Meneghel. 2004. Geomorfologia Della Provincia Di Venezia. Note Illustrative Della Carta Geomorfologica Della Provincia Di Venezia. Padova: Esedra editrice.
- Bottazzi, Gianluca. 2000. ‘La Pianura Padana Dai Primi Insediamenti Alla Cultura Terramaricola Dell’età Del Bronzo’. In Un Po Di Terra. Guida All’ambiente Della Bassa Pianura Padana e Alla Sua Storia, edited by Carlo Ferrari and Lucio Gambi, 347–66. Reggio Emilia: Diabasis.
- Brown, A. G. Alluvial Geoarchaeology: Floodplain Archaeology and Environmental Change. Cambridge Manuals in Archaeology. Cambridge: Cambridge University Press, 1997.
- Cambi, Franco, and Nicola Terrenato. 1994. Introduzione all’Archeologia dei Paesaggi. Roma: Nuova Italia scientifica.
- Campana, Stefano. 2018. Mapping the Archaeological Continuum: Filling ‘Empty’ Mediterranean Landscapes. Cham: Springer International Publishing.
- Campo, B., L. Bruno, and A. Amorosi. 2020. ‘Basin-scale Stratigraphic Correlation of Late Pleistocene-Holocene (MIS 5e-MIS 1) Strata Across the Rapidly Subsiding Po Basin (Northern Italy)’. Quaternary Science Reviews 237 (June): 106300.
- Casarotto, Anita, Tesse D. Stek, Jeremia Pelgrom, Ruud H. van Otterloo, and Jan Sevink. 2018. ‘Assessing Visibility and Geomorphological Biases in Regional Field Surveys: The Case of Roman Aesernia’. Geoarchaeology 33 (2): 177–92.
- Castiglioni, G., R. Ajassa, C. Baroni, A. Biancotti, A. Bondesan, M. Bondesan, G. Brancucci, et al. 1997. Carta Geomorfologica della Pianura Padana. 3 Fogli alla scala 1:250.000. S.E.L.C.A. Firenze.
- Cavalazzi, Marco. 2012. ‘Progetto “Bassa Romandiola”. La Campagna di Ricognizione nel Territorio di Lugo di Romagna (RA)’. In Paesaggi, comunità, villaggi medievali, 703–8. Spoleto: CISAM.
- Cavalazzi, Marco, Michele Abballe, Anna Benato, and Michela De Felicibus. 2018. ‘Archeologia dei Paesaggi in Bassa Romagna. Il Progetto “Bassa Romandiola” (2009-2016)’. Archeologia Medievale 45: 317–34.
- Ceci, Monica, and Riccardo Santangeli Valenzani. 2016. La ceramica nello Scavo Archeologico: Analisi, Quantificazione e Interpretazione. Roma: Carocci.
- Ceraudo, Giuseppe, and Federica Boschi. 2009. ‘Fotografia Aerea per l’Archeologia’. In Groma 2. In Profondità Senza Scavare, 171–86. Bologna: BraDypUS communicating cultural heritage.
- Chouquer, Gérard. 2015. Les Parcellaires Médiévaux En Émilie et En Romagne. Centuriations et Trames Coaxiales. Morphologie et Droit Agraires. Paris: Observatoire des formes du foncier dans le monde. France International pour l’Expertise Foncière (FIEF).
- Cibin, Ubaldo. 2014. Carta Geologica d’Italia Alla Scala 1:50.000, Foglio 222, Lugo. Roma: ISPRA, Servizio geologico d’Italia.
- Cirelli, Enrico. 2006. ‘Classificazione e Quantificazione del Materiale nelle Ricerche di Superficie’. In Medioevo, Paesaggi e Metodi, edited by Nicola Mancassola and Fabio Saggioro, 169–78. Mantova: SAP.
- Collins, James. 2020. ‘Spatial Interpolation’. In Archaeological Spatial Analysis: a Methodological Guide, by Mark Gillings, Piraye Hacigüzeller, and Gary R. Lock, 118–34. Abingdon, Oxon: Routledge.
- Corrò, Elisa, Cecilia Moine, and Sandra Primon. 2015. ‘Reazioni Uguali e Contrarie. Evoluzione Paleoambientale e Trasformazioni Storiche Intorno al Monastero di Sant’Ilario e Benedetto (Dogaletto di Mira)’. Reti Medievali Rivista 16 (2): 103–50.
- Cowley, David C. 2016. ‘What Do the Patterns Mean? Archaeological Distributions and Bias in Survey Data’. In Digital Methods and Remote Sensing in Archaeology: Archaeology in the Age of Sensing, edited by Maurizio Forte and Stefano Campana, 147–70. Quantitative Methods in the Humanities and Social Sciences. Cham: Springer International Publishing. Cremaschi, Mauro. 2000. Manuale di geoarcheologia. Roma - Bari: GLF editori Laterza.
- Cremaschi, Mauro. 2000. Manuale di Geoarcheologia. Roma-Bari: GLF editori Laterza.
- Cremonini, Stefano. 1994. ‘Lineamenti Evolutivi Del Paesaggio Fisico Del Territorio Di Bagnacavallo Nel Contesto Paleoidrografico Romagnolo’. In Storia Di Bagnacavallo, edited by A. Calbi and G. Susini, 1:1–40. Bagnacavallo; Bologna: Comune di Bagnacavallo; Banca popolare dell’Adriatico.
- Dall’Aglio, Pier Luigi. 2000. ‘Il Survey e la Ricerca Storico-Topografica’. In La Topografia Antica, edited by Pier Luigi Dall’Aglio, 233–41. Bologna: CLUEB.
- Dall’Aglio, Pier Luigi, and Carlotta Franceschelli. 2012. ‘Bonifiche e Regimazioni Idrauliche Tra Pianificazione e Gestione Del Territorio’. In Caminhos Da Agua. Paisagens e Usos Na Long Duraçao, edited by Manuela Martins, Isabel Vaz de Freitas, and M. Isabel Del Val Valdivieso. Braga: CITCEM.
- De Felicibus, Michela. 2017. ‘Società e Popolamento Altomedievale nel Pievato di San Pietro in Sylvis’. Studi Romagnoli LXVIII: 457–70.
- Fahlander, Fredrick. 2013. ‘Postmodern Archaeologies’. In The Oxford Handbook of Archaeological Theory.
- Fiorotto, Celeste. 2018. ‘Human Settlement and Environment in the Medieval Bassa Romagna (Ravenna, Italy) c. 800–1200’. Medieval Settlement Research 33: 28–39.
- Fiorotto, Celeste, Maria Letizia Carra, and Marco Cavalazzi. 2020. ‘The Castrum of Zagonara. An Archaeobotanical Approach to the Study of a Medieval Castle’s Human-environment Dynamics’. In Humanities in the Third Millennium: Approaches, Contamination, and Perspectives, edited by Marta Tagliani, Vittoria Cianciani, and Francesco Tommasi, 125–37. Verona: Cierre Edizioni.
- Flannery, Kent Vaughn. 1976. The Early Mesoamerican Village. New York: Academic Press.
- Forte, Maurizio, and Stefano Campana, eds. 2016. Quantitative Methods in the Humanities and Social Sciences. Quantitative Methods in the Humanities and Social Sciences. Cham: Springer International Publishing.
- Franceschelli, Carlotta, and Stefano Marabini. 2007. Lettura di un territorio sepolto: La pianura Lughese in età romana. Bologna: Ante Quem.
- Gattiglia, Gabriele, and Anna Maria Stagno. 2005. ‘La Documentazione Scritta nella Ricognizione Archeologica sul Territorio: un “Vecchio” Sistema di Schedatura’. Archeologia Medievale 32: 453–60.
- Given, Michael. 2004. ‘Mapping and Manuring: can we Compare Sherd Density Figures?’ In Side-by-side Survey: Comparative Regional Studies in the Mediterranean World, edited by S. E. Alcock and J. F. Cherry, 13–21. Oxford: Oxbow Books.
- Lloyd, John, and Graeme W. W. Barker. 1981. ‘Roman Settlement in Rural Molise: Problems of Archaeological Survey’. In Archaeology and Italian Society, edited by Graeme W. W. Barker and Richard Hodges, 375–416. Oxford: British Archaeological Reports.
- Longhena, Mario, Antioni Bandini Buti, Carlo Tagliavini, Alfredo Bonaccorsi, and Luigi Simeoni. 1936. ‘Romagna’. In Enciclopedia Italiana. Roma: Istituto dell’Enciclopedia Italiana. Accessed 2 April 2021. https://www.treccani.it/enciclopedia/romagna_(Enciclopedia-Italiana).
- Mancassola, Nicola. 2008. ‘Le Forme del Popolamento Rurale nel Territorio Decimano dalla Caduta dell’Impero Romano all’Anno Mille’. In Orme Nei Campi. Archeologia a Sud Di Ravenna, 89–104. Firenze: All’Insegna del Giglio.
- Marabini, Stefano, and Carlotta Franceschelli. 2004. ‘Assetto Paleoidrografico e Centuriazione Romana nella Pianura Faentina’. Agri Centuriati: an International Journal of Landscape Archaeology 1: 87–107.
- Marabini, Stefano and Gian Battista Vai. 2020. Carta Geologica della Pianura tra Imola e Ravenna: Guida alla Lettura. Imola: Thèodolite editore.
- Mills, Jessica. 2007. ‘Surveying the Claylands: Combining Aerial Survey and Fieldwalking Methods in Identifying Archaeological Sites on Difficult Soils’. In Populating Clay Landscapes, edited by Jessica Mills and Rog Palmer, 132–46. Stroud: Tempus.
- Mozzi, Paolo, Silvia Piovan, and Elisa Corrò. 2020. ‘Long-Term Drivers and Impacts of Abrupt River Changes in Managed Lowlands of the Adige River and Northern Po Delta (Northern Italy)’. Quaternary International, EX-AQUA 2016: Palaeohydrological Extreme Events, Evidence and Archives, 538 (February): 80–93.
- Negrelli, Claudio. 2008. ‘Dalla Tarda Antichità all’Alto Medioevo (V-IX Secolo)’. In A misura d’Uomo. Archeologia del Territorio Cesenate e Valutazione dei Depositi, edited by Sauro Gelichi and Claudio Negrelli, 237–56. Borgo S. Lorenzo (FI): All’Insegna del Giglio.
- Opitz, Rachel S., Krysta Ryzewski, John F. Cherry, and Brenna Moloney. 2015. ‘Using Airborne LiDAR Survey to Explore Historic-era Archaeological Landscapes of Montserrat in the Eastern Caribbean’. Journal of Field Archaeology 40 (5): 523–41.
- Orton, Clive. 2000. Sampling in Archaeology. New York: Cambridge University Press.
- Otárola-Castillo, Erik, and Melissa G. Torquato. 2018. ‘Bayesian Statistics in Archaeology’. Annual Review of Anthropology 47 (1): 435–53.
- Philipps, Philip, James A. Ford, and James B. Griffin. 1951. Archaeological Survey in the Lower Mississippi Alluvial Valley, 1940-1947. Cambridge, Massachusetts: Harvard University.
- Rovelli, Carlo. 2020. Helgoland. Milano:Adelphi.
- Rucco, Alessandro Alessio. 2015. Comacchio nell’Alto Medioevo: Il Paesaggio tra Topografia e Geoarcheologia (Premio Ottone d’Assia e Riccardo Francovich 2014). Contributi di archeologia medievale 11. Sesto Fiorentino (FI): All’Insegna del Giglio.
- Sagan, Carl, and Anne Druyan. 1997. The Demon-haunted World. Science as a Candle in the Dark. New York: Random House.
- Sanders, William T. 1970. The Teotihuacan Valley Project. Final Report. University Park, Pennsylvania: Department of Anthropology, The Pennsylvania State University.
- Shanks, Michael, and Christopher Y. Tilley. 1987. Re-constructing Archaeology: Theory and Practice. Cambridge: Cambridge University Press.
- Severi, Paolo and Giorgio Cremonini. 2009. Carta Geologica d’Italia alla Scala 1:50.000, Foglio 239, Faenza. Roma: ISPRA, Servizio geologico d’Italia.
- Terrenato, Nicola. 2000. ‘The Visibility of Sites and the Interpretation of Field Survey Results: Towards an Analysis of Incomplete Distributions’. In Extracting Meaning from Ploughsoil Assemblages, edited by Riccardo Francovich, Helen Patterson, and Graeme Barker, 60–71. Oxford: Oxbow Books.
- ———. 2004. ‘Sample Size matters! The Paradox of Global Trends and Local Surveys’. In Side-by-side Survey: Comparative Regional Studies in the Mediterranean World, edited by Susan Alcock and John Cherry, John F., Oxbow, 36–48. Oxford.
- Tilley, Christopher. 1974. A Phenomenology of Landscape: Places, Paths, and Monuments. Oxford: Berg.
- Tosco, Carlo. 2009. Il Paesaggio Storico: le Fonti e i Metodi di Ricerca tra Medioevo ed Età Moderna. Roma-Bari: Laterza.
- Vandam, Ralf. 2019. ‘Introduction: On the Margins? Thinking through “Marginal” Landscapes in the Holocene Mediterranean’. Journal of Eastern Mediterranean Archaeology & Heritage Studies 7 (4): 407–11.
- Vascelius, Gary S. 1960. ‘Archaeological Sampling: a Problem in Statistical Inference’. In Essays in the Science of Culture, In Honor of Leslie A. White, edited by Gertrude E. Dole and Robert L. Carneiro, 457–70. New York: Crowell.
- Vasina, Augusto, and Pier Vincenzo Mengaldo. 1970. ‘Romagna’. In Enciclopedia Dantesca.
- Veggiani, Antonio. 1995. ‘Storia Geologica Ed Evoluzione Ambientale Nel Territorio Di Lugo Di Romagna’. In Storia Di Lugo, edited by Leardo Mascanzoni and Augusto Vasina, 9–54. Forlì.
- Vita-Finzi, Claudio. 1969. The Mediterranean Valleys: Geological Changes in Historical Times. Cambridge: The University Press.
- Volpe, Giuliano, and Roberto Goffredo. 2014. ‘La Pietra e il Ponte : Alcune Considerazioni sull’Archeologia Globale dei Paesaggi’. Archeologia Medievale XLI: 39–53.
- Wallach, Efraim. 2019. ‘Inference from Absence: the Case of Archaeology’. Palgrave Communications 5 (1): 1–10.
- Whitehead, N., and S.K.F. Stoddart. 1991. ‘Cleaning the Iguvine Stables: Site and Off-Site Analysis from a Central Mediterranean Perspective’. In Interpreting Artefact Scatters: Contributions to Ploughzone Archaeology, edited by A. J. Schofield, Oxbow Books, 141–48. Oxford.
Notes
1. Orton 2000, 40, with an overview on the related debate.
2. E.g.: Binford 1964; some prodromes reported by E.B. Banning (2020a, 4): Philips, Ford, and Griffin 1951; Vascelius 1960.
3. Bannings 2020a, 5.
4. Shanks and Tilley 1987.
5. B. Mayer-Oakes and R. Nash at the 1964 meetings of the American Anthropological Association performed a theoretical task: they applied a stratified sampling strategy to an existing project, the Teotihuacan Valley survey project of William Sander (1970), using a stratified random sampling strategy, according to L. Binford indications (1964); the sample missed the most important site of the area, the city of Teotihuacan itself (see the discussion reported in Flannery 1976, 133-135).
6. An overview in Banning 2020a.
7. Alcock and Cherry 2004; Opitz et al. 2015.
8. Terrenato 2004, 37; Cremaschi 2000, 220-26; Cowley 2016.
9. Opitz et al. 2015; cfr. also Volpe and Goffredo 2014; Campana 2018, 31-42.
10. Vita-Finzi 1969, 101-02; Brown 1997, 1-5; Dall’Aglio 2000, 237-38; Franceschelli and Marabini 2007, 76-93.
11. Dall’Aglio 2000, 239; Denham 2017.
12. Longhena et al. 1936.
13. Vasina and Mengaldo 1970.
14. Cibin 2014; Severi and Cremonini 2009; Marabini and Vai 2020.
15. Bitelli, Bonsignore, and Unguendoli 2000; Campo, Bruno, and Amorosi 2020.
16. Franceschelli and Marabini 2007, 78 and 194; Cavalazzi et al. 2018; Abballe 2020.
17. For a synthesis cfr. Castiglioni et al. 1997; Franceschelli and Marabini 2007, 76-93; Marabini and Vai 2020.
18. Regarding the analysed area, cfr. for instance the synthesis in: Bottazzi 2000; Dall’Aglio and Franceschelli 2012; Chouquer 2015.
19. For a summary of the results: Cavalazzi et al. 2018.
20. Cavalazzi 2012; Cavalazzi et al. 2018.
21. Cavalazzi et al. 2018.
22. De Felicibus 2017; Cavalazzi et al. 2018.
23. Cavalazzi et al. 2018.
24. Banning 2002, 89-90.
25. Cambi and Terrenato 1994, 161-79.
26. According to Gattiglia and Stagno 2005.
27. Cambi and Terrenato 1994: 256-57. The device was a GPS Garmin 64s.
28. The threshold of site definition on fieldwork was related to every single Topographical Unit and subjectively defined by the field coordinator, dr. Marco Cavalazzi; further statistical analysis did not change substantially this preliminary distribution.
29. Campana 2018: 31-42.
30. The preliminary phase of the research was funded by the Center of Study on the “Bassa Romandiola Nord-Occidentale” of Bagnacavallo and was performed in the winter of 2008 by the author, under the direction of prof. Andrea Augenti and dr. Nicola Mancassola.
31. Fortunately some scholars tried to overcome this limit, as Stefano Marabini (2020, with Gian Battista Vai, or 2007, with Carlotta Franceschelli) and Michele Abballe (2020); see also footnote n. 39.
32. Orton 2000, 30; Banning 2020b, 45. On the contrary, a proportional stratified sample adopts the same proportion between sample and population (the “sampling fraction”) in every strata.
33. Orton 2000, 34-38 and 90-91: an adaptive strategy implies to change the sample facing some predetermined condition, e.g. to find a relevant cluster of sites, as it was in our case. This actually happened during the 2009 field-campaign, when a cluster of archaeological sites was found in the area of Zagonara -Lugo, RA- (Cavalazzi et al. 2018).
34. Banning et al. 2017.
35. The chronology of the sites can be less wide than indicated; the range reported is the widest defined for the sites included in the category.
36. For a synthesis: Cavalazzi et al. 2018.
37. Mancassola 2008; Negrelli 2008.
38. Macroscopic biases are active at site level, while microscopic biases are active at the artefact level (infra, and cfr. Terrenato 2004, 38-39; Given 2004, 19).
39. In this field the studies are numerous; I will mention just some main references related to area analysed and, more in general, to the south-eastern part of the Po Valley: Cremonini 1994; Veggiani 1995; Marabini, Franceschelli 2004; Rucco 2015, 109-14; Mozzi, Piovan, and Corrò 2020.
40. Bondesan and Meneghel 2004, 133-134; Marabini and Franceschelli, 2004, 28.
41. Vita-Finzi 1969; Ammerman and Bonardi 1981; between the last: Terrenato 2004, 39. An archaeological approach to an extreme situation (all the archaeological deposits buried and hidden by a relevant alluvial deposit) in: Corrò, Moine, and Primon 2015.
42. This kind of problem is discussed in: Terrenato 2004, 39.
43. On the use of off-site scattered artefacts: Bintliff and Snodgrass 1988; Whitehead and Stoddart 1991.
44. With the Inverse Distance Weighting (IDW) algorithm, we interpolated the centroids of every Topographical Unit, associated to the value of the dating of the earlier artefact found in it (Collins 2020, 120-21).
45. See below the discussion on inferencing from absence.
46. Franceschelli and Marabini 2007, 31-32; Marabini and Vai 2020.
47. Abballe and Cavalazzi in press and infra.
48. Franceschelli and Marabini 2007, 31;
49. Terrenato 2004, 38-39.
50. Ceci and Santangeli Valenzani 2016, 20-21; Cirelli 2006.
51. Lloyd and Barker 1981, 291.
52. Sagan and Druyan 1997, 213; for a review: Wallach 2019.
53. Banning 2002, 204-05; Wallach 2019.
54. Dall’Aglio 2000, 237-38.
55. Wallach 2019.
56. Tilley 1994.
57. Terrenato 2004; Fahlander 2014.
58. Terrenato 2000; Casarotto 2019.
59. The research is coordinated by Michele Abballe, Ghent University.
60. Abballe 2020; cfr. Franceschelli and Marabini 2007, 78.
61. Fiorotto 2018.
62. Also this part of the research started recently and it is coordinated by Celeste Fiorotto, University of Verona (Fiorotto et al. 2020).
63. It is impossible to refer to all the studies highlighting the importance of remote sensing in landscape archaeology; here just several recent references: Ceraudo and Boschi 2009; Forte and Campana 2016.
64. Otárola-Castillo and Torquato 2018; for an application to this context: Abballe 2017.
65. Rovelli 2020, 40, 68-69.
66. Tosco 2009, 151.
67. Vandam 2019; referring to this area: Abballe and Cavalazzi in press.
68. Dall’Aglio 2000, 235-36; Mills 2007; Cowley 2016, 167.